
CO2 emissions are the key indicators often used to measure the environmental friendliness or harmfulness of an activity. CO2 emissions, together with other greenhouse gases, are increasingly responsible for climate change.
That is why we have taken a close look at the CO2 emissions of our operations. We have also looked at existing study results on the greenhouse gas balance of holiday types. On this page, we are happy to disclose the results to you. It is time to correct the negative image of ski tourism.
One thing is quite clear from the studies: the journey to and from the destination accounts for the major part of the CO2 consumption of a holiday. Frequent, short holidays such as city trips by plane over the weekend and long-distance air travel are therefore more harmful to the climate than a one-week skiing holiday in Austria, which one ideally even travels to by train.
Together with the consulting firm ClimatePartner, we analyzed the energy consumption of all our departments and activities for the first time in 2019. Over several months, we gathered information from all areas, broke down data, and calculated our CO2 footprint. Four years later, we conducted our second CO2 assessment and were already able to achieve significant savings in this short period of time.
In the 2019/20 winter season, our ski operations caused 4,149.1 tons of CO2. In the 2023/24 season, emissions were reduced to 1,638 tons of CO2. This corresponds to a reduction of over 60%.
- Switch to HVO (Hydrotreated Vegetable Oils) for all 30 snow groomers
- Use of HVO fuels for the scheduled ski buses throughout the ski area
- Climate-friendly measures for employee transport, such as electrically powered minibuses
Particularly effective: By using only green electricity, over 9,800 tons of CO2 have already been saved compared to the Austrian electricity mix.
Overview of CO2 distribution
2019/20 | 2023/24
How can we reduce our carbon footprint?
Based on these findings, we have decided on the following measures:
We work closely with our regional partners such as hotels, mountain hut owners, etc. and coordinate the results with them so that they can also do help reduce CO2 emissions. This way we ensure that you also have sustainable alternatives during your skiing holiday or skiing day which go beyond the pure skiing operation.
Short-term measures
- Reduce ski bus journeys or optimise the frequency of buses so that empty journeys are avoided.
- Create incentives for lower-emission employee mobility, e.g. switch to e-vehicles.
- Convert employee shuttles to e-buses in winter.
- Switch to CO2-neutral printed products with the “FSC Mix 70 %” seal.
- Promote ski buses even more in order to save on individual transport.
- Raise our employees’ awareness of where they can save CO2 and encourage their own creativity in terms of potential savings.
Medium-term measures
- Promote offers for climate-neutral arrival and departure (e.g. expand cooperation projects with ÖBB/ Austrian Federal Railways).
- Convert our ski buses from diesel to lower-emission drive technologies (e.g. electric buses).
- Convert the company’s own vehicle fleet to electric mobility, where possible.
- Seek measures to reduce CO2 emissions in piste preparation. Here we are particularly dependent on general technological development
100 % green electricity at Snow Space Salzburg
We get our electricity from Salzburg AG. That’s why we asked Markus Matschl, the head of renewable energy at Salzburg AG, exactly how this green electricity mix is made up. Here are the most important facts from the interview:
- Salzburg AG supplies Snow Space Salzburg Cable Cars with 100 % renewable energy (green electricity mix: approx. 85 % hydropower, approx. 10 % wind energy and approx. 5 % photovoltaics and other renewable energy forms).
- Snow Space Salzburg requires 25 million kilowatt hours per year. This is equivalent to the energy used by about 4,000 single-family households.
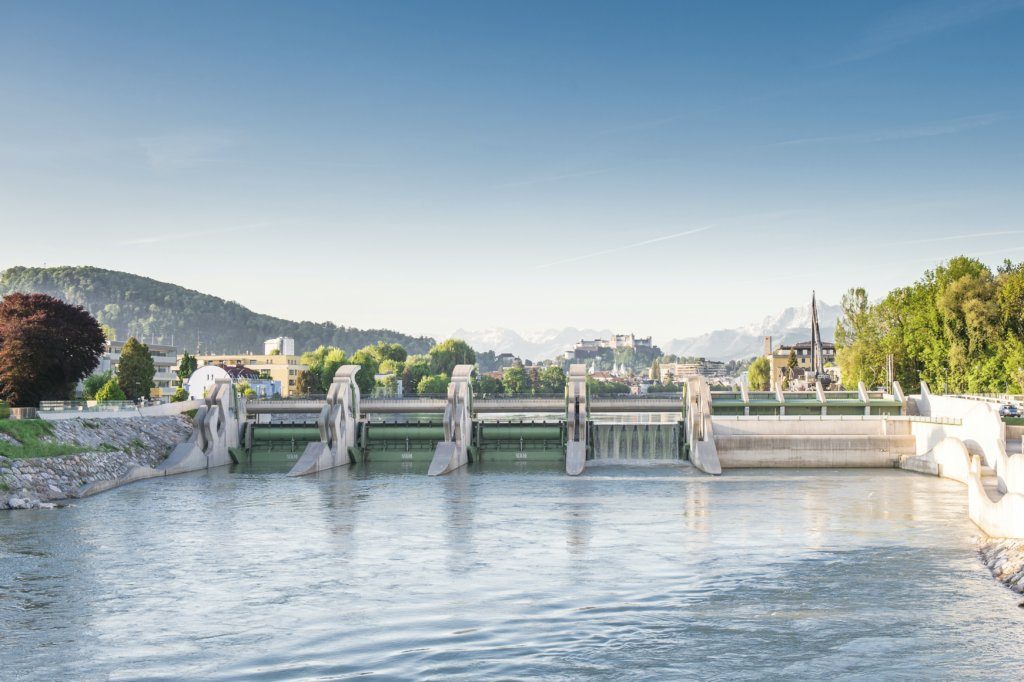
- The run-of-river power plant in St. Johann im Pongau alone produces about three times the annual electricity consumption of Snow Space Salzburg Cable Cars. This power plant in St. Johann im Pongau is only one of the 3 important small hydroelectric power plants in the region.
Comparison of CO2 balance of different holidays
The climate debate is getting louder and louder, and when you go on holiday, your guilty conscience may go with you. But you can decide for yourself what kind of holiday you want to take. Because not every holiday necessarily has to be harmful to the environment.
In 2018, the Austrian Federal Office conducted an interesting survey on the greenhouse gas balance of typical types of holidays. It found the following:
- The journey to and from the destination causes the largest CO2 emissions on a holiday. On a typical skiing holiday, it is up to 70 %. The distance between the holiday destination and home is significant.
- For shorter distances, people use their car or ideally the train; for longer distances, they use a plane.
- Air travel causes 2.69% of CO2 emissions worldwide.
- When it comes to accommodation, the choice of facilities is important. Air conditioning, heated swimming pools, saunas etc. have a negative impact on the energy balance. The progressiveness of the establishment is also important. In the Maldives, for example, diesel generators are typically used, whereas in Austria most of the energy comes from hydroelectric power. In terms of holiday activities, a skiing or summer holiday in Austria is lower in terms of CO2 emissions than other types of holiday. Typical behaviour on a long-distance trip causes higher CO2 emissions.
You can read a summary of the study results here:
Further interesting study results can be found on the website of the Cable Car Association:
The interview (in German) with Univ.-Prof.in Dipl.-Ing.in Dr.in Ulrike Pröbstl-Haider also summarises the topic very well.